SIP Calculator Zerodha is a specialised financial analytics tool designed for the Indian Mutual Fund market Investors to track their SIP Returns in Zerodha. Unlike standard calculators that use a fixed or “hypothetical” interest rate, a SIP calculator primarily functions as a Historical NAV Back-tester.
SIP Calculator
Other Tools and Calculators :- PPP Calculator, Gold Rate Today Buldhana
Above Calculator show monthly 5000 investment from your bank with 12% annual returns on that investment and 10 years of time period, helping you to earn 5,61,695, with a total value after adding principal is 11,61,695.
Analysis provides a comprehensive examination of the SIP Calculator ecosystem in India, focusing on the mechanics of systematic investing plans, the mathematical advantages of “Step-Up” strategies for everyone, and the utility of historical NAV-based performance tracking for Indian mutual fund investors.

SIP Calculator Zeordha Basics To Understand Before Investing
In the landscape of Indian retail investing, the Systematic Investment Plan (SIP) has transitioned from a niche financial product to a household necessity. While a standard SIP calculator provides a linear projection based on an assumed fixed interest rate, the SIP Calculator suite represents a more sophisticated “Phase 2” toolset.
There are many SIP calculators, but Sharecirculate Star SIP shows realistic data. Nowadays, Silver SIP, Gold SIP and Stock SIP are becoming very popular among investors because they give them more asset allocation and risky diversfy options.
It is different from therotical 12% or 15% annual returns and focuses on Live Returns—calculating wealth creation based on actual historical Net Asset Value (NAV) data. This allows investors to see how specific funds (like Axis Bluechip, SBI Small Cap, or Parag Parikh Flexi Cap) actually performed through market cycles, including crashes and bull runs.
How Pavan Padghan Invested in a Mutual Fund Through Zerodha SIP Calculator
Since I am currently pursuing my MA in Psychology, I am analysing how our emotions—like fear and greed—impact our long-term financial decisions. To explain how this SIP (Systematic Investment Plan) calculator works, let’s look at my own financial strategy through the lens of an investor and a psychology student.
I trust in the power of compounding, but I also know that “loss aversion” makes people quit too early. Here is how I would use this tool to stay disciplined.
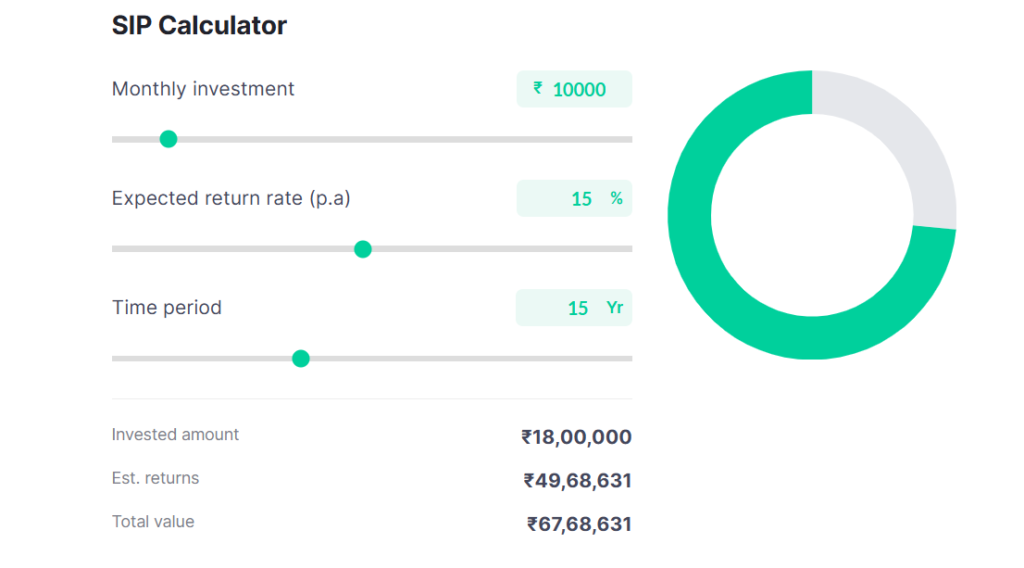
In this example, I am planning for a long-term goal. I want to see what happens if I consistently invest a portion of my earnings from my Development work and all earnings invested over the next 15 years.
- Monthly Investment: ₹10,000
- Expected Return Rate: 15% p.a. (Targeting equity-oriented mutual funds)
- Time Period: 15 Years
The Calculation breakdown from my Investment
Using the formula integrated into the code:
FV = P \times \frac{(1 + i)^n – 1}{i} \times (1 + i)
Where:
- P (Monthly investment) = ₹10,000
- i (Monthly interest rate) = 15\% / 12 / 100 = 0.0125
- n (Total months) = 15 \times 12 = 180
The Results and Wealth I Would Generate From My Disciplined Investing Strategy
If I add these details to my Star SIP Calculator, here is what my 15-year commitment looks like. You can learn from my decisions and consistency.
| Metric | Value |
| Total Invested | ₹18,00,000 |
| Estimated Returns | ₹49,68,963 |
| Total Wealth Created | ₹67,68,963 |
Psychological Insight: Notice that my returns (approx. ₹49.6 Lakh) are nearly three times my actual invested amount. This is the “Magic of Compounding.” In the first 5 years, the growth feels slow, which is where most investors quit. As a psychology student, I call this the “Endurance Phase”—if you can survive the boredom of the early years, the exponential growth in the final years creates the real wealth.
In India, most of the people choose SIP but stop not because they feel bored but because of their financial conditions and their family’s urgent problems. My friend Rahul Giri invested in mutual funds when he was in BCA in pune, but quit because his family need money to buy house.
The Core Pillar: The Step-Up SIP Calculator
The most powerful feature within the Star SIP framework is the Step-Up (or Top-Up) SIP. Most investors start with a modest amount, but as their careers progress and salaries increase, their investible surplus grows.
The Mathematics of the Step-Up
A traditional SIP remains stagnant. If you start with ₹10,000, you invest ₹10,000 for 20 years in ICICI Preduential Technology Fund. A Step-Up SIP assumes an annual increase (typically 10%).
The difference is staggering due to the Compounding of Contributions:
- Year 1: ₹10,000/month
- Year 2: ₹11,000/month
- Year 3: ₹12,100/month
By increasing the principal amount every year, you are not just compounding the returns, but compounding the input. Over a 20-year horizon, a 10% annual step-up can result in a final corpus that is more than 100% larger than a flat SIP, even with the same underlying fund performance.
The “Live Return” Feature: Reality vs. Projections
Standard calculators use the Compound Annual Growth Rate (CAGR) formula:
$$A = P \times \frac{(1 + i)^n – 1}{i} \times (1 + i)$$
Where $i$ is the periodic interest rate and $n$ is the number of periods.
However, the stock market does not move in a straight line. The Star SIP Live Return tool uses XIRR (Extended Internal Rate of Return). It maps every monthly instalment to the actual NAV of the fund on that specific date.
Why this matters:
- Rupee Cost Averaging: It demonstrates how more units were bought when the market was down (e.g., March 2020) and fewer when it was high.
- Investor Psychology: Seeing a table of historical “negative return” months followed by ultimate wealth creation helps investors build the “stomach” required for long-term equity exposure.
Advanced Modules: SWP and Lumpsum Integration
Beyond the accumulation phase, the Star SIP suite addresses the Distribution Phase through the Systematic Withdrawal Plan (SWP) Calculator.
The SWP Logic
For retirees or those seeking “FIRE” (Financial Independence, Retire Early), the SWP tool calculates how a corpus can provide a steady monthly “salary” while the remaining balance continues to grow in the market. The calculator helps solve for three variables:
- Sustainability: How long will the money last if I withdraw $X$ amount?
- Inflation-Adjusted Withdrawals: Increasing the withdrawal amount annually to keep up with rising costs.
- Terminal Value: What will be left for heirs after 25 years of withdrawals?
The Psychological Intersection: Psychology of the Investor
As one studies the data provided by these calculators, a clear psychological pattern emerges, often linked to Behavioural Finance:
- Loss Aversion: Investors often want to stop SIPs when the “Live Return” shows red. The calculator’s historical data proves that these are actually the “Wealth Creation” windows where units are cheapest.
- Recency Bias: If a fund has given 40% in the last year, investors assume it will continue. The Star SIP 10-year view provides a sobering, realistic average (usually 12-18%).
Strategic Asset Allocation
The calculator serves as a map for Goal-Based Investing. Instead of “investing for returns,” users can reverse-engineer their needs:
- Goal: ₹1 Crore for a child’s education in 15 years.
- Input: 12% expected return.
- Output: The calculator defines the exact monthly SIP required today.
- Optimisation: If the required SIP is too high, the “Step-Up” tool shows how starting lower and increasing annually can still hit the target.
Core Website Features of Zerodha SIP (Internal Knowledge)
The “Performance” Dashboard
The site is built around tracking historical data using the XIRR (Extended Internal Rate of Return) method.
Live SIP Return: Unlike basic calculators that use fixed percentages, this tool pulls historical NAV data. You pick a scheme and a start date, and it shows you exactly what your return is as of today. One-Time (Lump Sum) Tracker: Shows the absolute growth and CAGR of a single investment made in the past.
Strategic Simulators
These are the “Big Three” tools that help with the complex movement of money:
Step-Up SIP: It calculates the impact of an annual increment. The unique feature here is the year-by-year schedule, which shows:
- Yearly Investment Amount.
- Cumulative Investment.
- Projected Wealth Gain.
SWP (Systematic Withdrawal Plan): Often used for “Pension” planning. It shows how much capital is left after you take out monthly income, helping you avoid “Capital Erosion.” STP (Systematic Transfer Plan): It calculates the benefit of parking money in a liquid fund and moving it to equity, showing the interest earned on the “waiting” capital.
AMC-Wise Categorisation
This is a navigation-heavy feature. It organises funds by the Fund House (AMC):
You can view all schemes from a single house (e.g., Nippon India or SBI) on one page. It allows for SIP AMC-Wise comparison, so you can see if one fund house is consistently beating its peers across multiple categories.
Detailed Scheduling & Export
One of the most practical features for serious investors or advisors:
Instalment Tables: It generates a row-by-row list of every SIP payment you would have made. PDF/Report Generation: Many of these tools allow you to generate a professional-looking performance report to save or share.
NFO & Live NAV Updates
NFO Tracking: A dedicated section for New Fund Offers, listing the open and close dates. Live NAVs: A quick-search bar to find the current Net Asset Value of any SEBI-registered mutual fund.
Why these features matter
Most standard calculators (like those on bank websites) are static—they assume a fixed 12% return. The features on a platform like Star SIP are dynamic; they use actual market history to show you how a fund really performed through ups and downs.
Conclusion: The Utility of Precision
The Zerodha SIP Calculator is more than a digital math sheet; it is a bridge between a financial “plan” and “reality.” By utilising real NAV data, accounting for annual increments (Step-Up), and modelling the eventual withdrawal (SWP), it provides a full-lifecycle view of wealth.
For the modern Indian investor—especially those balancing profession, family, and long-term goals—these tools remove the guesswork from the equity markets. They replace “hope” with “data,” ensuring that the journey toward financial freedom is calculated, disciplined, and resilient against market volatility.
